

Whenever I’m faced with a data mashup problem in Power BI, I try to check if it can be resolved with standard M functions exposed by the intrinsic variable #shared. Unfortunately,Navigating this data structure when you don’t know what you’re looking for seems to be a tedious task. Until recently, my function discovery workflow included turning the output of #shared into a table and then searched for keywords in the name of the functions hoping that the developers called the functions accordingly. However, after discovering where the documentation for the functions is stored, I’ve come up with more flexible ways of navigating the 600+ definitions.
Function documentation
A while ago, I stumbled across a wonderful GitHub repository — Power BI Desktop Query Extensions written by Taylor Clark. This is one of those hidden treasures that is filled with golden nuggets. I recommend it to anyone interested in taking their Power Query skills to the next level. Although the repository is actually a single file with 545 LOC, in those lines, you’ll see some of the best examples of text, list and table manipulation. My favourite finds are those on testing and documenting M functions.
Apparently, the documentation that you see while browsing #shared is stored as a metadata record on the type of the functions.
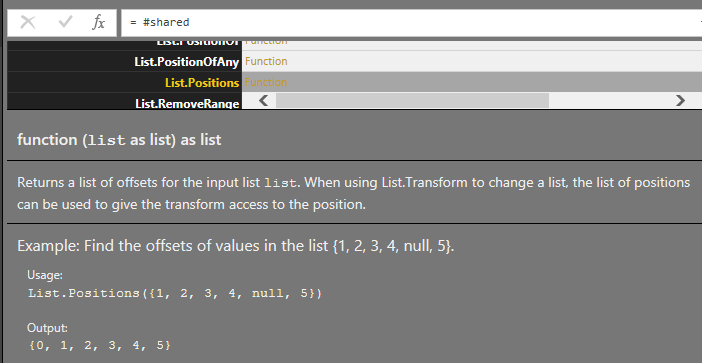
To view it, you need to first check the type of the function and then retrieve the metadata. For example:
= Value.Metadata(Value.Type(List.Positions))
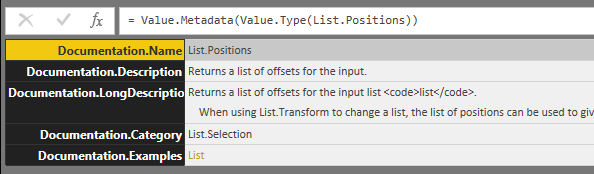
Something that looks like a record in the query view, can easily be transformed into a table. And there are so many ways you can render the information stored as a table.
Function signature
Before proceeding any further, there is still one piece of the puzzle missing —the signature of the functions. Unfortunately, I couldn’t find it neither in the documentation metadata nor via other standard functions. So I had to roll out a custom query that generates a text like:
"function (list as list) as list"
It uses a combination of Type.FunctionParameters, Type.FunctionReturn and a looooong list of type to text conversion.
| (placeholder as function)=> | |
| let | |
| //Serialize type to text | |
| TypeAsText = (value as any) => | |
| let | |
| prefix = if Type.IsNullable(value) then "nullable " else "" | |
| in | |
| prefix&( | |
| if Type.Is(value, type binary) then "binary" else | |
| if Type.Is(value, type date) then "date" else | |
| if Type.Is(value, type datetime) then "datetime" else | |
| if Type.Is(value, type datetimezone) then "datetimezone" else | |
| if Type.Is(value, type duration) then "duration" else | |
| if Type.Is(value, type function) then "function" else | |
| if Type.Is(value, type list) then "list" else | |
| if Type.Is(value, type logical) then "logical" else | |
| if Type.Is(value, type none) then "none" else | |
| if Type.Is(value, type null) then "null" else | |
| if Type.Is(value, type number) then "number" else | |
| if Type.Is(value, type record) then "record" else | |
| if Type.Is(value, type table) then "table" else | |
| if Type.Is(value, type text) then "text" else | |
| if Type.Is(value, type time) then "time" else | |
| if Type.Is(value, type type) then "type" else | |
| if Type.Is(value, type any) then "any" | |
| else error "unknown"), | |
| //if parameter is Optional set prefix | |
| OptionalPrefix = (_)=>if Type.IsNullable(_) then "optional " else "", | |
| //get list of function parameters | |
| parameters = Type.FunctionParameters(Value.Type(placeholder)), | |
| //create a text list of parameters and associate types "[optional] paramname as type" | |
| parametersWithTypes = List.Accumulate(Record.FieldNames(parameters),{}, | |
| (state,cur)=>state&{ | |
| OptionalPrefix(Record.Field(parameters,cur))& | |
| cur&" as "&TypeAsText(Record.Field(parameters,cur))}) | |
| in | |
| //merge parameter list and prefix with "function (" and suffix with function return type | |
| "function ("& | |
| Text.Combine(parametersWithTypes,", ")& | |
| ") as "& | |
| TypeAsText(Type.FunctionReturn(Value.Type(placeholder))) |
Stitching everything together
I’ve started from #shared record, transforming it to table, then filtering only on function definitions and then added columns one by one for Category, Description, function Examples and Signature. Finally, after some string manipulation to parse the Module names I ended up with the query below.
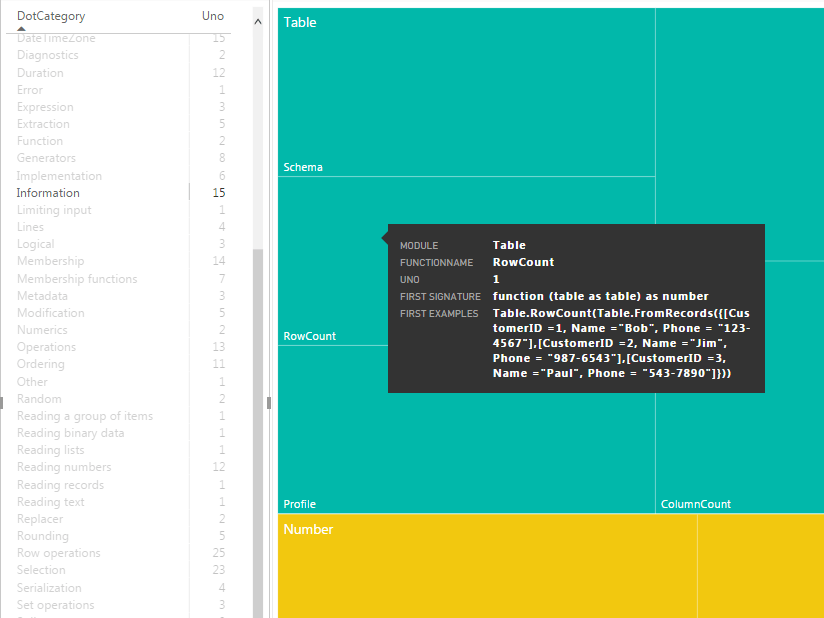
I was planning to represent this data in a tile chart. Similar to a periodic table. However, after experiencing performance problems while rendering 600 tiles with Infographic Designer 1.5.2, I gave up on the whole idea and opted to visualize all of this information in a treemap.
I’ve added a dummy column([Uno]) with value 1 and used it as a Value field in the treemap chart. Then I’ve added column [Module] to the Group field and the [FunctionName] in the Details section. All of the remaining columns: [Description], [Signature] and [Examples], I’ve added to the Tooltips section of the chart. To control the treemap, I’ve used a matrix that acts as a filter on [Category] column.
Click to view the embedded version of the report 👈

1 Comment